Key Differences between VT and SVT
VT more likely to have... 1. AV dissociation 1. fusion complexes 2. capture beats 3. P waves 2. Extreme axis deviation 3. Concordance
R-wave peak time
- In lead II, RWPT ≥ 50 ms suggests VT (sensitive and specific)
- However, this is optimal in VT vs SVT+RBBB and LAFB, but not with LBBB

Brugada Algorithm
 1. Absence of RS complex in all precordial leads
1. This is equivalent to positive or negative concordance. Do all precordial leads consist of monophasic R or S waves? If so, this is VT. If there are any RS complexes (i.e. biphasic), then proceed to the next step, this could be SVT.
2. Example of RS complex:
1. Absence of RS complex in all precordial leads
1. This is equivalent to positive or negative concordance. Do all precordial leads consist of monophasic R or S waves? If so, this is VT. If there are any RS complexes (i.e. biphasic), then proceed to the next step, this could be SVT.
2. Example of RS complex:  2. R to S interval > 100 ms in 1 precordial lead
1. If the RS complexes are present in precordial leads, then assess the RS interval (the onset of the R wave to the nadir of the S wave). If over 100 ms, then VT is diagnosed:
2. R to S interval > 100 ms in 1 precordial lead
1. If the RS complexes are present in precordial leads, then assess the RS interval (the onset of the R wave to the nadir of the S wave). If over 100 ms, then VT is diagnosed:  3. AV dissociation
1. this means P waves are present at a different rate to the QRS ("marching through"), or there are fusion or capture beats:
3. AV dissociation
1. this means P waves are present at a different rate to the QRS ("marching through"), or there are fusion or capture beats:  4. Morphological criteria for VT in V1-2 and V6. There are two possible criteria depending on the QRS in V1:
1. Dominant R wave in V1: is it RBBB-like?
1. Three different patterns indicate VT in V1. Note that the classic RSR' of RBBB is more indicative of SVT with RBBB instead of VT.
1. Smooth monophasic R wave
2. Notched downsloping R wave: the taller "left rabbit ear" (Marriott's sign):
4. Morphological criteria for VT in V1-2 and V6. There are two possible criteria depending on the QRS in V1:
1. Dominant R wave in V1: is it RBBB-like?
1. Three different patterns indicate VT in V1. Note that the classic RSR' of RBBB is more indicative of SVT with RBBB instead of VT.
1. Smooth monophasic R wave
2. Notched downsloping R wave: the taller "left rabbit ear" (Marriott's sign): 3. qR complex
2. The following are consistent with VT in V6:
1. QS complex (completely negative complex without R wave)
2. R/S ratio < 1 (small R wave, deep S wave). However, this indicates VT only if LAD is also present.
2. Dominant S wave in V1: is it LBBB-like?
1. The following are diagnostic of VT in V1-2:
1. Initial R wave > 30-40 ms duration
2. Notching or slurring of the S wave (Josephson sign)
3. RS interval > 60-70 ms
4.
3. qR complex
2. The following are consistent with VT in V6:
1. QS complex (completely negative complex without R wave)
2. R/S ratio < 1 (small R wave, deep S wave). However, this indicates VT only if LAD is also present.
2. Dominant S wave in V1: is it LBBB-like?
1. The following are diagnostic of VT in V1-2:
1. Initial R wave > 30-40 ms duration
2. Notching or slurring of the S wave (Josephson sign)
3. RS interval > 60-70 ms
4.  2. The following are indicative of VT in V6:
1. QS waves (as in RBBB-like patterns)
2. qR complex (small q wave, large R wave):
2. The following are indicative of VT in V6:
1. QS waves (as in RBBB-like patterns)
2. qR complex (small q wave, large R wave):  3.
3. 
Vereckei Algorithm (Original)
There is some overlap between the Vereckei and Brugada algorithms, but one of the most useful tips from the Vereckei algorithm is to examine the QRS complex in lead aVR.
- AV dissociation is a strong indictor of VT and therefore is step 1.
- Dominant initial R wave in aVR is indicative of VT. Conversely, a dominant terminal R' wave in aVR (i.e. following a Q/S wave) is more likely SVT with aberrancy or something such as TCA toxicity.
- Notching on the initial downstroke of a predominantly negative QRS complex.
- Ventricular activation–velocity ratio (vi/vt) <1; vi/vt is the vertical excursion (in millivolts) recorded during the initial (vi) and terminal (vt) 40 ms of the QRS complex.
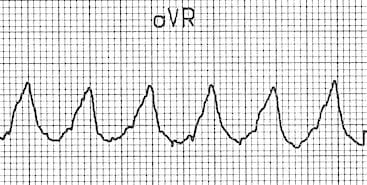 Example of dominant initial R wave (VT)
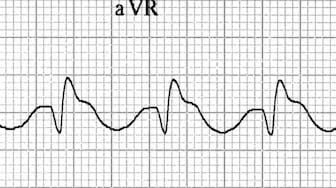 Example of dominant terminal R wave (SVT with aberrancy)
Vereckei - aVR Only (2008)
New algorithm using only lead aVR for differential diagnosis of wide QRS complex tachycardia
- presence of an initial R wave,
- width of an initial r or q wave >40 ms (one small square)
- notching on the initial downstroke of a predominantly negative QRS complex,
- ventricular activation-velocity ratio (v(i)/v(t)), the vertical excursion (in millivolts) recorded during the initial (v(i)) and terminal (v(t)) 40 ms of the QRS complex
- Vi/Vt <= 1 suggests VT
- Vi/Vt > 1 suggests SVT
